Welcome to causal-curve’s documentation!
causal-curve is a Python package with tools to perform causal inference when the treatment of interest is continuous.
Summary
(Version 1.0.0 released in Jan 2021!)
There are many available methods to perform causal inference when your intervention of interest is binary, but few methods exist to handle continuous treatments. This is unfortunate because there are many scenarios (in industry and research) where these methods would be useful. This library attempts to address this gap, providing tools to estimate causal curves (AKA causal dose-response curves). Both continuous and binary outcomes can be modeled with this package.
Quick example (of the GPS_Regressor tool)
causal-curve uses a sklearn-like API that should feel familiar to python machine learning users.
This includes _Regressor and _Classifier models, and fit() methods.
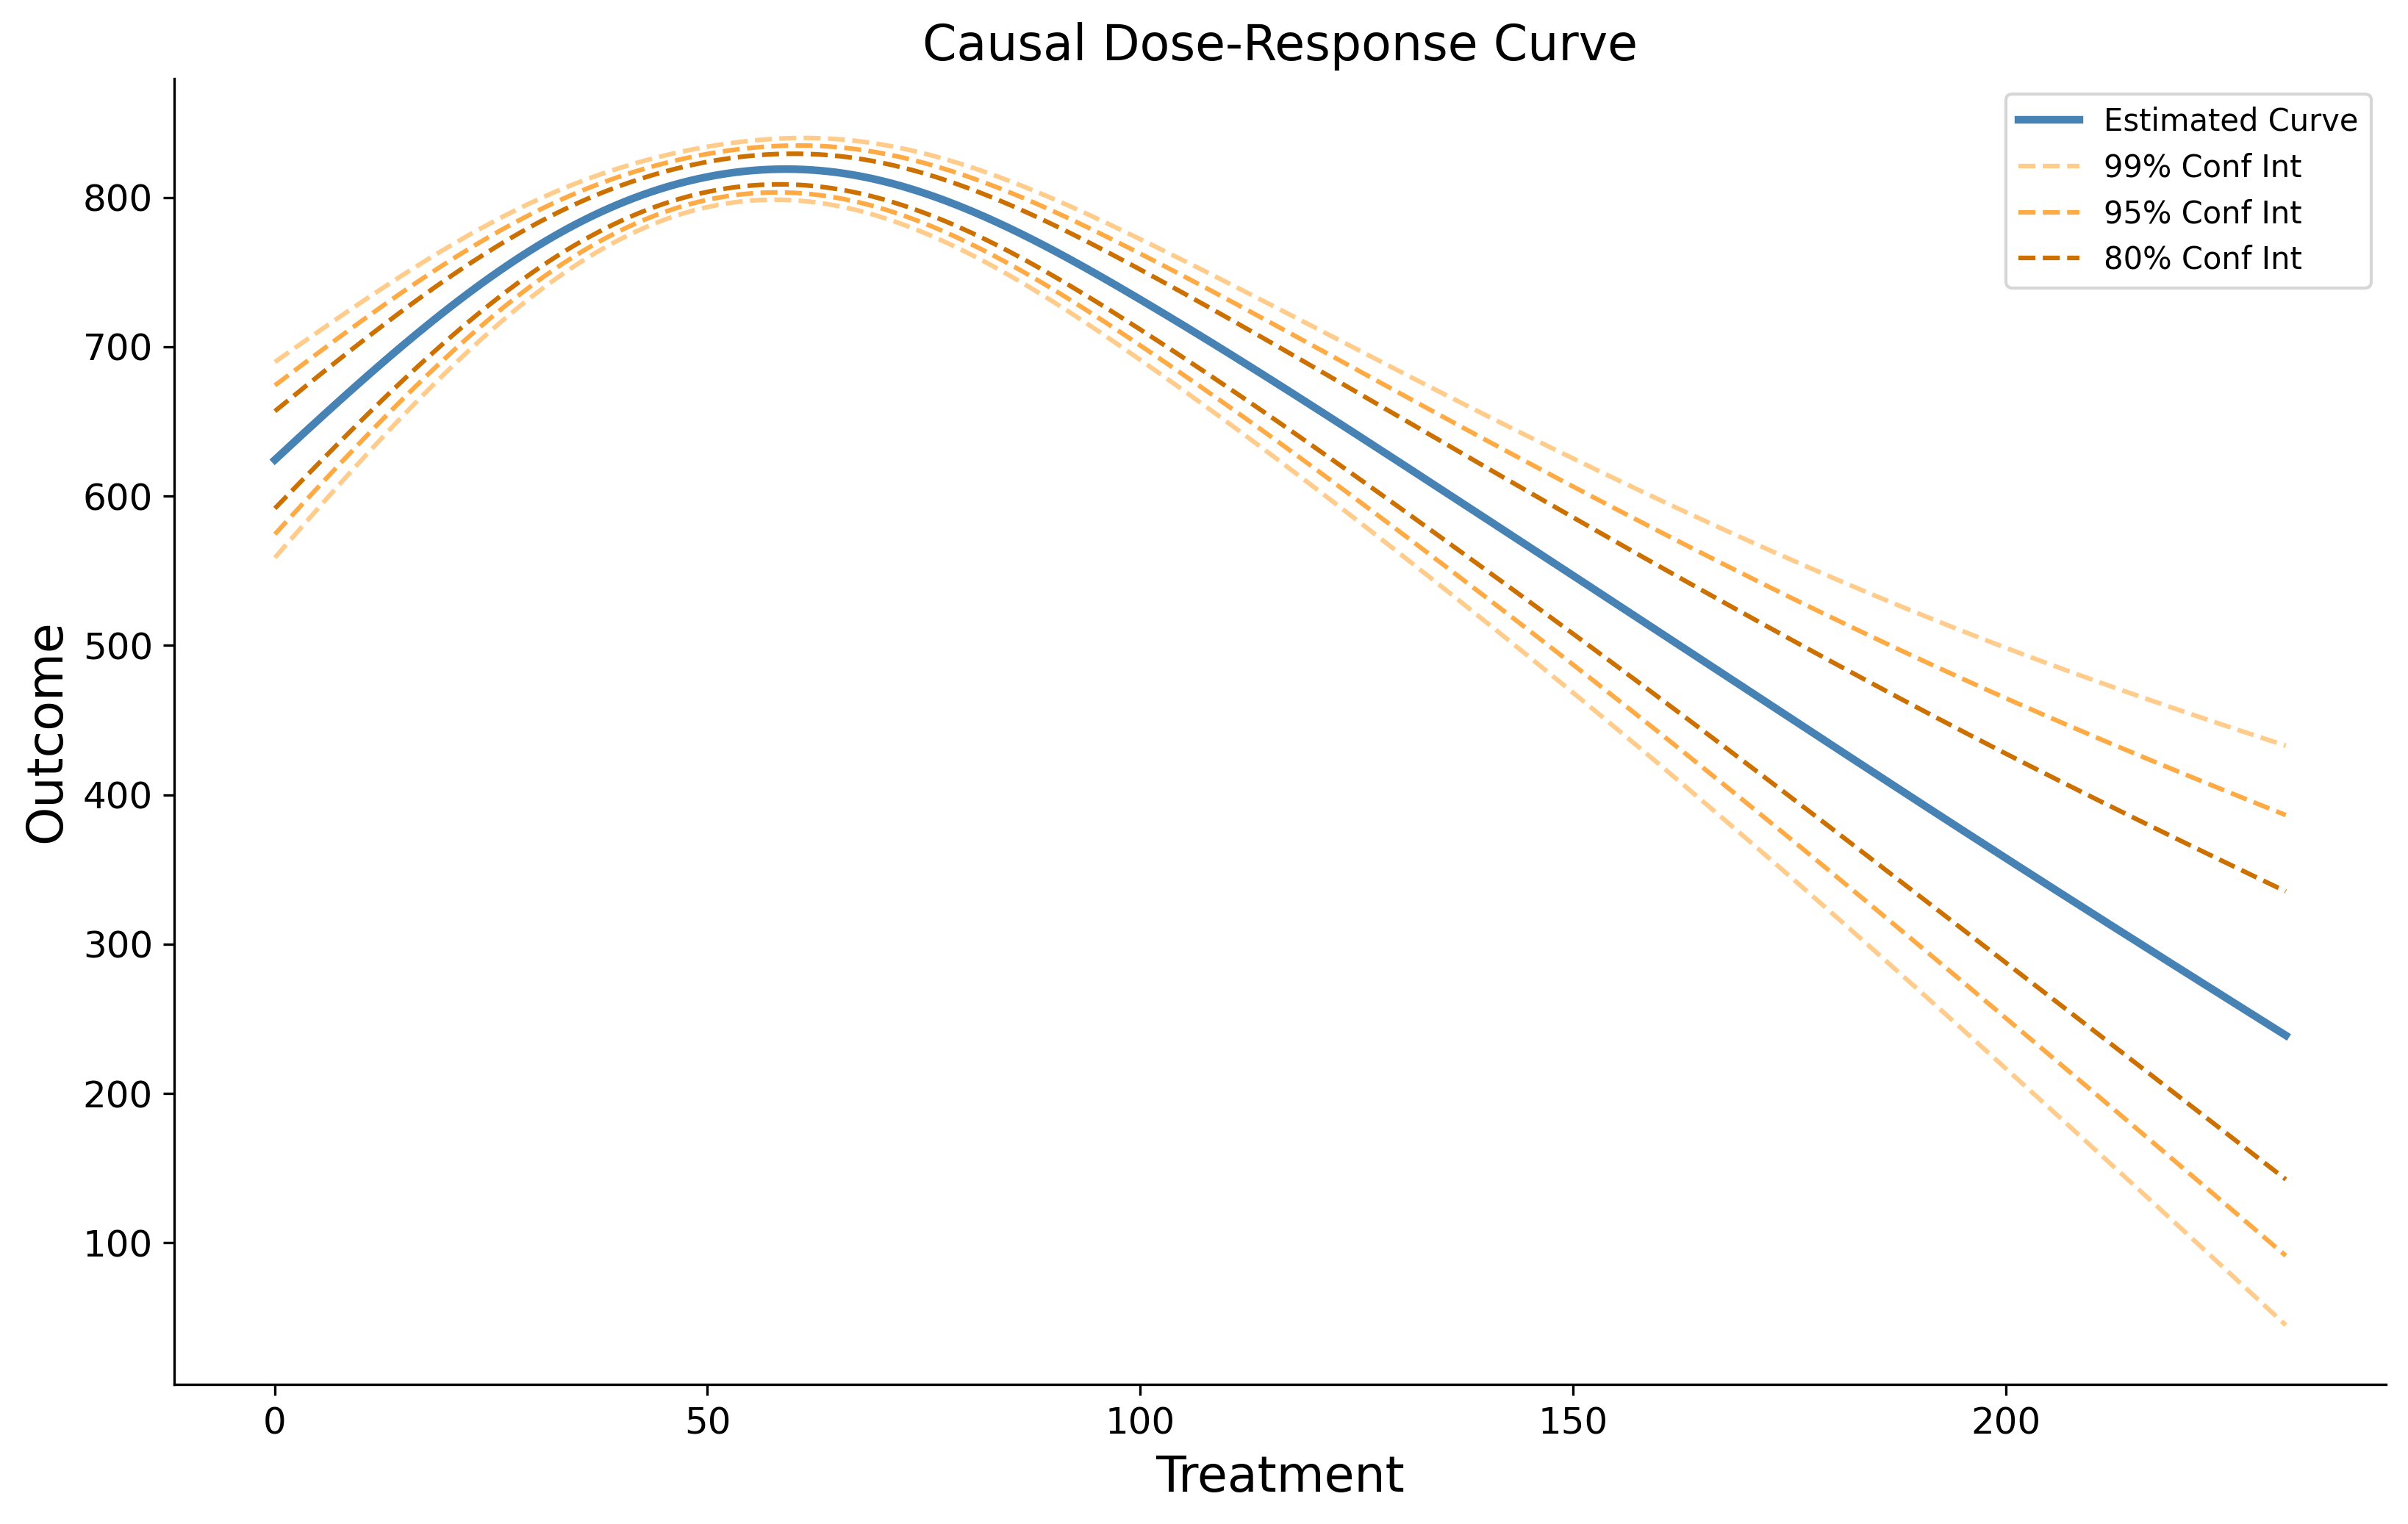
The following example estimates the causal dose-response curve (CDRC) by calculating generalized propensity scores.
>>> from causal_curve import GPS_Regressor
>>> import numpy as np
>>> gps = GPS_Regressor(treatment_grid_num = 200, random_seed = 512)
>>> df # a pandas dataframe with your data
           X_1       X_2  Treatment    Outcome
0     0.596685  0.162688   0.000039  -0.270533
1     1.014187  0.916101   0.000197  -0.266979
2     0.932859  1.328576   0.000223   1.921979
3     1.140052  0.555203   0.000339   1.461526
4     1.613471  0.340886   0.000438   2.064511
>>> gps.fit(T = df['Treatment'], X = df[['X_1', 'X_2']], y = df['Outcome'])
>>> gps_results = gps.calculate_CDRC(ci = 0.95)
>>> gps_point = gps.point_estimate(np.array([0.0003]))
>>> gps_point_interval = gps.point_estimate_interval(np.array([0.0003]), ci = 0.95)
- First we import the GPS_Regressor class.
- Then we instantiate the class, providing any of the optional parameters.
- Prepare and organized your treatment, covariate, and outcome data into a pandas dataframe.
- Fit the load the training and test sets by calling the
.fit()method. - Estimate the points of the causal curve (along with 95% confidence interval bounds) with the
.calculate_CDRC()method. - Generate point estimates along the causal curve with the
.point_estimate(),.point_estimate_interval(), and.estimate_log_odds()methods. - Explore or plot your results!